Ex-Alta 1 vs Ex-Alta 2
Science

Ex-Alta 1: Space Weather

Ex-Alta 1’s primary scientific mission objective was to study space weather using a Digital Fluxgate Magnetometer with the goal to observe plasma flow interactions of the earth’s magnetosphere and lower ionosphere with data from the QB50 constellation.

Space weather events occur when high energy charged particles from the sun interact with and cause fast changes in the Earth’s magnetic field. These fast changes can be very damaging to electrical systems on Earth which our society is heavily dependent on. The following image by the European Space Agency provides a visual summary of how changes in solar activity can affect us.

Image source: http://www.esa.int/ESA_Multimedia/Images/2018/01/Space_weather_effects

Such disturbances include failure in electrical grids and satellite navigational systems, air plane travel and telecommunications, and many more. In an extreme event entire cities would be incapacitated. The September 2nd, 1859 Carrington Event was a geomagnetic storm that damaged telegraph lines leading to fires and injuring workers. Mild events are relatively common and are not likely to cause disturbance to everyday activities; however, if a similar event to Carrington were to happen today it would lead to trillions of dollars in total remediation costs (Boteler et al, 1998) and an unthinkable amount of societal chaos.The best form of action is to invest in forecasting these storms and alerting power grid officials and cities to take certain steps to mitigate possible damages. This may include disrupting regular life in the short term for the overall safety of all citizens.

The solar cycle describes the periodic changes in the sun’s activity. Every 11 years the sun has a strong increase in solar storm activity. There is an increased probability of geomagnetic storms occurring near the peaks of the cycle. According to NASA, the next solar maximum is predicted in 2025. The image below shows the sun during solar maximum (left, April 2014) and solar minimum (right, December 2019) during the current cycle (credits: NASA). Currently, NASA has heliophysics observatories carrying out missions to keep an eye out for changes in our surrounding space environment. The models and data collected by these observatories are available for public and private use to encourage awareness and facilitate innovation. If you are interested feel free to check out the  Integrated Space Weather Analysis System (ISWA). To see what the sun is doing right now check out NASA’s Solar Dynamics Observatory (SDO).

Source: https://www.nasa.gov/press-release/solar-cycle-25-is-here-nasa-noaa-scientists-explain-what-that-means/

Ex-Alta 2: Wildfires

Wildfires are unplanned events that can cause severe ecological changes to the landscape and threaten communities. Wildfire research is being conducted to further understand wildfire impacts on the landscape and how it spreads. Satellites are being used to help detect and study the effects of wildfire. Heat detection satellites can detect new starts, and the spread of fires in remote areas to responding wildfire agencies. Satellite imagery is used to access changes in vegetation over large areas that would have otherwise been impossible to access by ground. Satellites have become an effective tool for wildfire prevention and prediction.

Burn Severity is used by wildfire scientists to describe the impacts of wildfire. It is used to describe the condition of the vegetation after a fire has burned the area. Burn severity is grouped into four condition classes; “unburned”, “low”, “moderate” and “high”. Before satellite imagery was used, burn severity was done with ground surveys. With satellite imagery, large areas, and near real time updates can be provided by analyzing the visible and near infrared light to detect the amount of “green” vegetation left on the landscape. 

An Orthophoto from a fire (left), image by Landsat 8 (center), and the calculated burn severity (right) from these photos. (credit: Parks Canada 2020 - Kierra Smith) .
Ground surveys showing the classes of severity of fire. (credit: Parks Canada 2020 - Kierra Smith) .

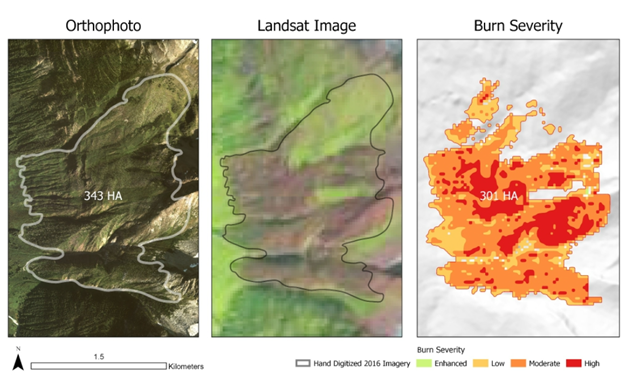
Using satellites is not without challenges. Burn severity assessments detect small changes in visible and infrared light reflected by vegetation. Photos need to be taken in daylight when the skies are clear. There can be no clouds or smoke impairing the images. Timely imagery is required to isolate the changes directly to the wildfire. Imagery is required to be continually updated prior to the wildfire and taken as soon as the smoke from the fire has cleared. Burn severity indexes are most accurate when done within days of the fire before new vegetation can grow or debris falls to the ground. Ex-Alta 2 will provide another eye in the sky that can help take timely imagery to create burn severity indexes. 

Ex-Alta 2’s inclusion of the Iris pushbroom style multispectral imager will enable us to analyze spectral bands required to calculate NDVI and NBR indexes. These indexes play an important role in creating accurate fire severity assessments for prevention and prediction.

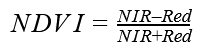
NDVI: Normalized difference vegetation index is calculated using the visible and near infrared light that is reflected by vegetation. Healthy vegetation absorbs visible light leaving a strong NIR (Near Infrared) reflectance signature; therefore, areas with less dense or unhealthy vegetation have stronger reflectance of visible light (red/green/blue). Processing data using the formula presented below gives an output of either -1 or +1. Areas of dense vegetation will have values close to +1 while a lack or absence of vegetation will be close to zero. Iris will utilize the Red and NIR bands which are used to determine the NDVI and thus the amount of vegetation in the region of interest.

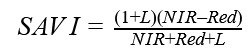
One disadvantage of NDVI is its inability to properly assess soil brightness in areas of low vegetation. Application of a Soil Adjusted Vegetation Index (SAVI) will be required to correct for these inconsistencies.

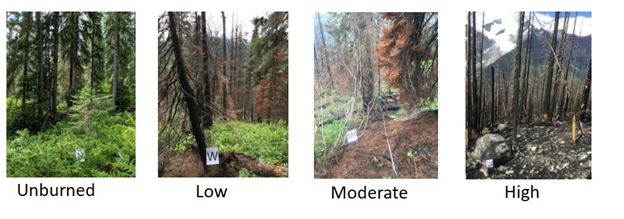
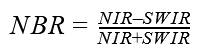
NBR: Normalized Burn Ratio uses the calculated ratios of short wave Infrared (SWIR) reflectance and near infrared (NIR) reflectance to identify burned areas and quantify the burn severity. SWIR helps identify changes in water content and soil exposure [Jensen, 2000; Lillesand and Kiefer, 2000] while NIR is sensitive to the vegetation density/biomass.

With this information we can eventually calculate a normalized dynamic burn severity of the landscape by comparing these indices before and after a wildifre.

Please remember, advances in satellite heat detection are only part of the wildfire prevention and prediction programs. Public reporting of wildfires are invaluable to responding agencies! 

If you come across a wildfire burning in the forest, report it toll-free at 310-FIRE (3473)

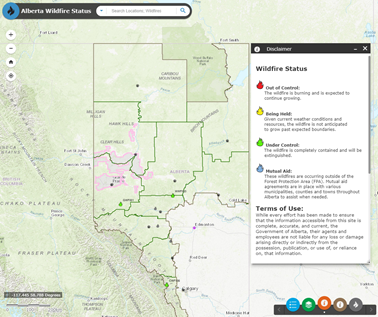
And follow this link to see the real time Alberta wildfire status map provided by the Government of Alberta. 

Real time Wildfire Status Map.

This page was last updated June 2021